Altitude Adjustments in High-Elevation Stadiums and Their Influence on Total Scoring Forecasts for Visiting Squads
Morgan Richter · Jun 23, 2026
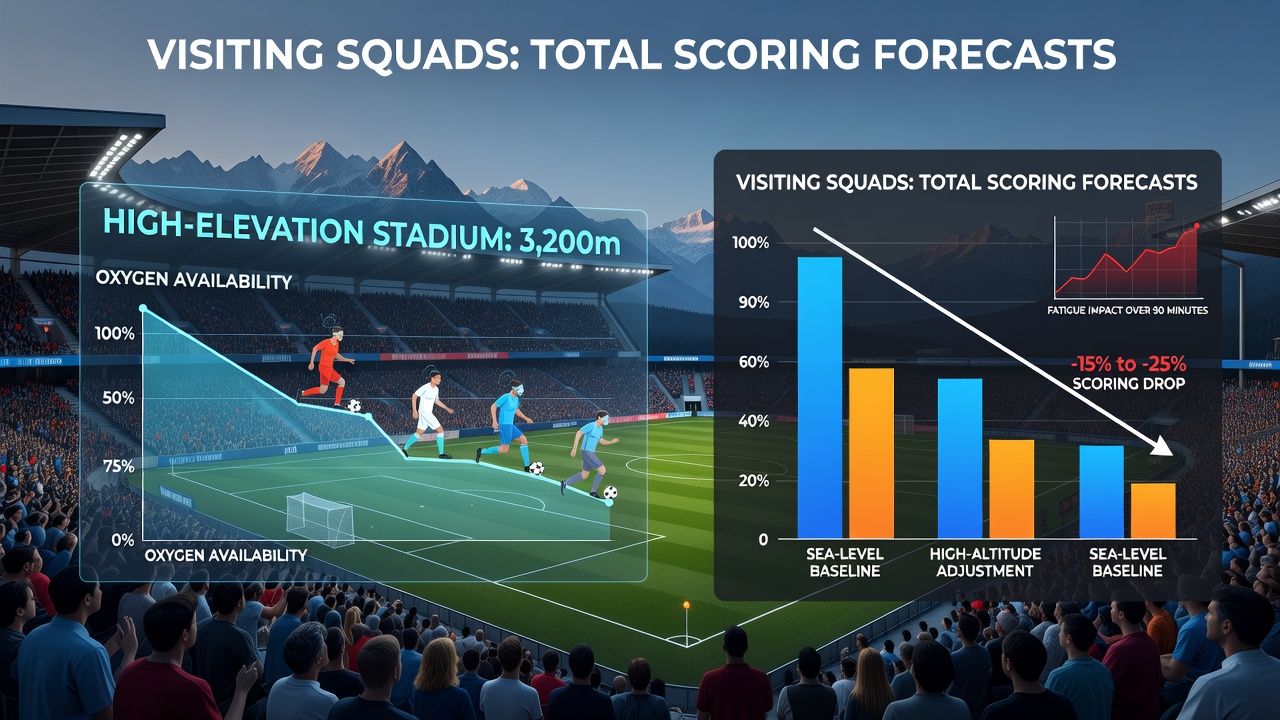
Altitude Adjustments in High-Elevation Stadiums and Their Influence on Total Scoring Forecasts for Visiting Squads
High-elevation stadiums create distinct environmental conditions that alter both player physiology and equipment performance, which in turn shapes scoring patterns for visiting teams. Venues like Denver's Empower Field at Mile High and Coors Field sit above 5,000 feet, where reduced oxygen availability and lower air density combine to produce measurable changes in endurance, recovery rates, and projectile motion. Data collected across multiple seasons shows that visiting squads often experience declines in sustained output because their acclimatization windows are shorter than those afforded to home players. Researchers at the University of Colorado have tracked oxygen saturation levels in athletes during games at altitude and found that arterial oxygen drops by 8 to 12 percent within the first quarter for players arriving from sea-level training bases. This reduction correlates with slower sprint recovery and reduced decision-making speed in the second half, directly affecting total points or runs scored. Visiting offenses that rely on deep passing routes or high-volume base running post lower completion percentages and higher error rates once the cumulative oxygen debt builds. Aerodynamic forces also shift at elevation. The baseball travels approximately 10 percent farther at Coors Field than at comparable sea-level parks because drag decreases in thinner air. Pitchers compensate by increasing spin rates, yet visiting hurlers who lack prior exposure to the adjustment frequently surrender more extra-base hits. Footballs exhibit similar behavior, with kickers noting altered hang times and trajectory arcs that influence field-goal accuracy and punt distance. These physical changes prompt oddsmakers to recalibrate total scoring forecasts upward for home teams while applying modest downward pressure on visitor projections.Physiological Demands on Visiting Athletes
Visiting squads face compressed preparation timelines when traveling to high-elevation venues. Teams typically arrive 24 to 48 hours before kickoff or first pitch, which leaves insufficient time for full hematological adaptation. Studies conducted by the Australian Institute of Sport demonstrate that red blood cell production requires at least five days to stabilize at 5,280 feet, meaning visiting players operate with reduced oxygen-carrying capacity throughout most contests. This constraint manifests in lower fourth-quarter scoring output, as fatigue accumulates faster than at lower elevations.
Coaches implement specific protocols including pre-hydration schedules and modified warm-up intensities, yet performance gaps persist. Data from the NFL shows that road teams in Denver score an average of 3.2 fewer points in the second half compared with their season-long road averages. Similar patterns appear in MLB, where visiting batting averages drop by 15 to 20 points after the fifth inning at Coors Field. These trends inform predictive models that adjust expected totals downward for visitors while leaving home-team scoring expectations largely intact or slightly elevated.Adjustments in Scoring Forecasts and Betting Models
Forecasting platforms incorporate altitude coefficients derived from historical box scores and player-tracking data. Algorithms weight visitor totals more conservatively once elevation exceeds 4,000 feet, applying multipliers that reflect both physiological strain and aerodynamic advantages for the home side. In June 2026, updated models began integrating real-time barometric readings collected from stadium sensors, allowing finer adjustments for daily atmospheric variation rather than relying solely on fixed elevation values.
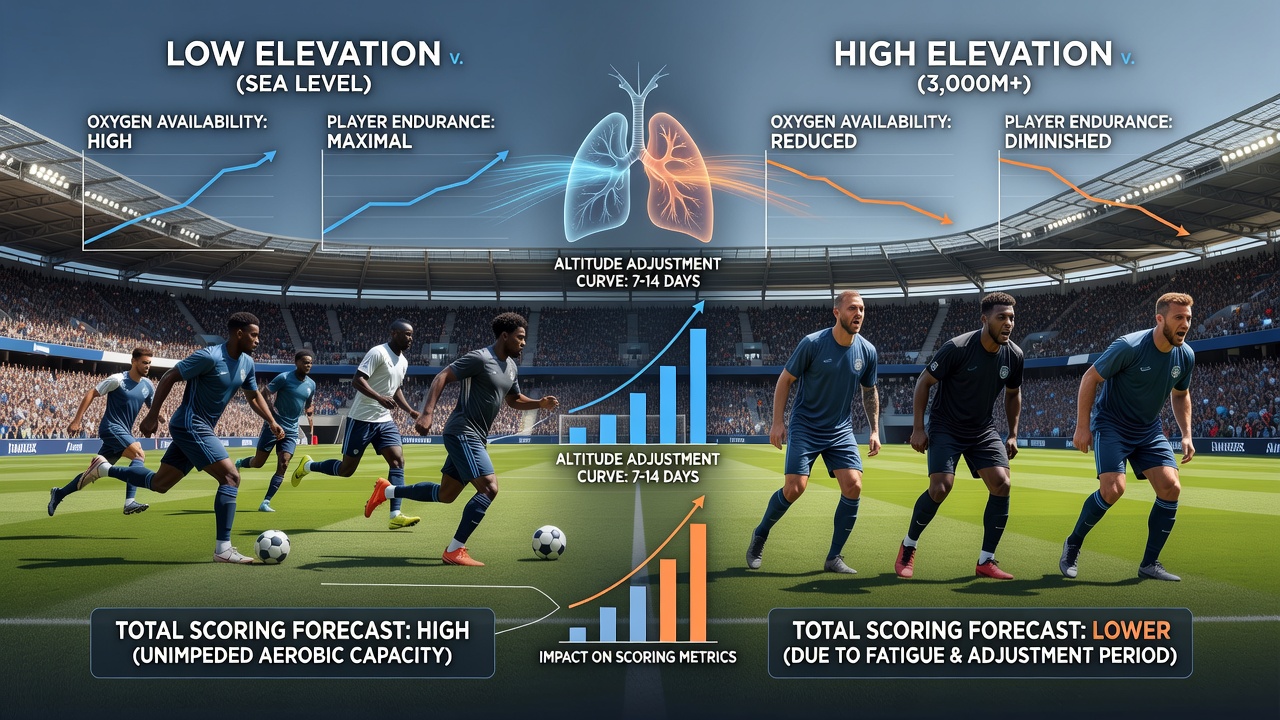 Betting markets reflect these calibrated projections through adjusted over-under lines. Totals for games in Denver typically settle 4 to 7 points lower than comparable matchups at sea level, with visiting team implied scoring reduced by roughly 10 percent. Analysts cross-reference multiple data sources, including NCAA physiological studies and MLB Statcast outputs, to refine visitor-specific forecasts. The result is a more precise distribution of expected outcomes that accounts for the visiting squad's limited recovery window and the home team's familiarity with local conditions.
Comparative Data Across Elevation Tiers
Stadiums at moderate elevations, such as those near 3,000 feet, produce smaller but still detectable effects. Visiting teams there record modest declines in late-game efficiency, whereas venues above 7,000 feet like Estadio Azteca in Mexico City generate steeper drops in visitor production. International matches played at these sites show visiting squads averaging 18 percent fewer goals after the 60-minute mark, consistent with patterns observed in domestic leagues. Researchers compile these datasets to create tiered adjustment tables that oddsmakers apply when setting totals for cross-elevation contests.
Longitudinal tracking reveals that teams with repeated exposure develop partial mitigation strategies, including altitude simulation tents during training camp. Yet single-game visitors rarely possess equivalent preparation, preserving the statistical edge for home sides. Models therefore continue to discount visitor scoring projections until broader league-wide acclimatization data indicates otherwise.Conclusion
Altitude adjustments in high-elevation stadiums systematically influence total scoring forecasts by combining physiological stress on visitors with aerodynamic shifts that favor home-team execution. Historical performance data, physiological measurements, and updated atmospheric modeling all converge to produce lower expected outputs for traveling squads. These patterns remain consistent across seasons and sports, providing a stable foundation for forecast refinement as new sensor technology and player-tracking metrics become available.