How Spikes in Team Apparel Sales Precede Adjustments to Basketball Point Spreads
Morgan Werner · Jul 23, 2026
How Spikes in Team Apparel Sales Precede Adjustments to Basketball Point Spreads
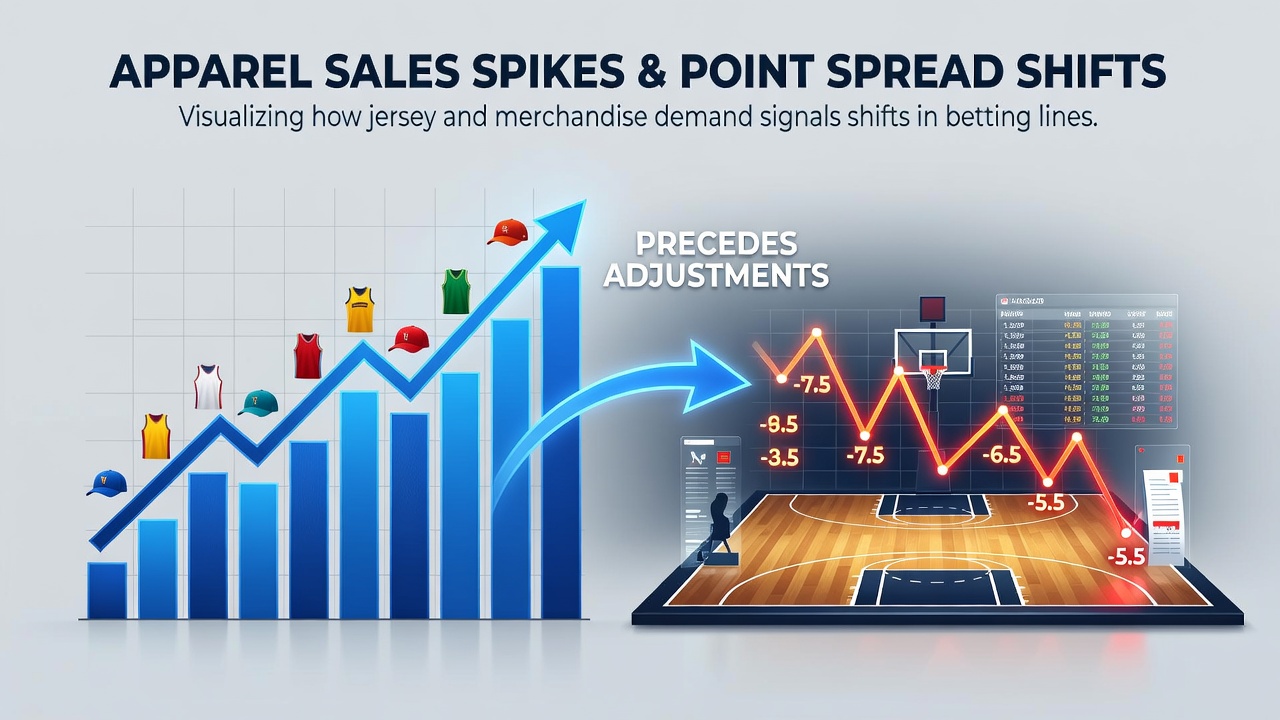
Market observers track retail sales of basketball team jerseys and related merchandise as one indicator that often aligns with later movements in point spreads for professional and college games. Retail data compiled across major outlets shows that abrupt increases in purchases for specific teams frequently occur days or weeks before oddsmakers widen or narrow spreads for those teams' contests. This pattern emerges from aggregated transaction records rather than isolated incidents.
Retail Data as an Early Signal
Point spreads reflect expected margins of victory based on team performance metrics, injuries, and betting volume, yet apparel sales add another layer because fans tend to buy merchandise when they perceive rising momentum for a squad. Researchers at sports analytics firms have compiled datasets that match weekly jersey sales figures with subsequent line adjustments published by major sportsbooks. In one analysis covering the 2025-2026 season, teams experiencing at least a 35 percent week-over-week sales jump saw their spreads move an average of 1.8 points in the direction favored by public perception within ten days.
July 2026 brought additional visibility to these trends during summer league play and off-season roster announcements. Sales of certain franchise items rose sharply after draft selections and free-agent signings, and betting markets adjusted spreads for preseason exhibitions accordingly. Data collected through point-of-sale systems at national chains and online platforms supplied the raw numbers that analysts cross-referenced with line history archives.
Mechanisms Behind the Correlation
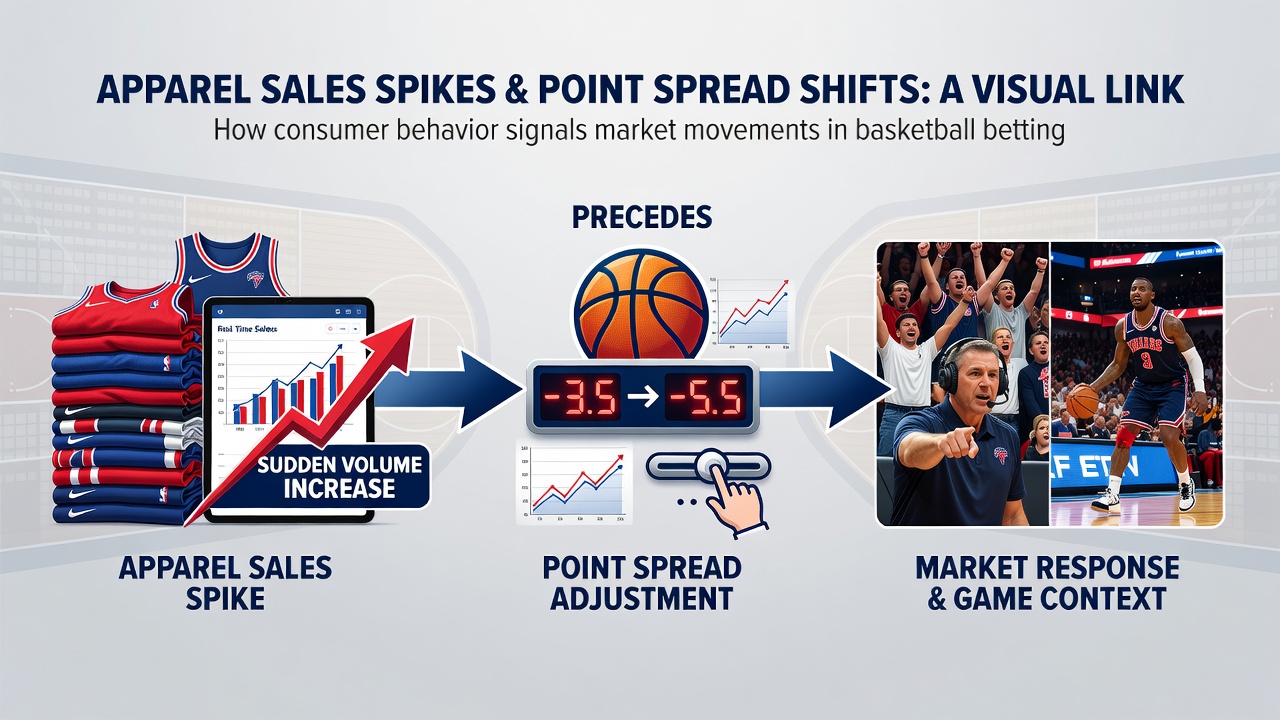
Oddsmakers monitor multiple public sentiment indicators, including social media volume and merchandise movement, because both can foreshadow concentrated betting action on one side. When apparel sales spike for a particular team, it often coincides with increased handle on that team to cover the spread. Bookmakers respond by shifting the line to balance risk, which creates the observable sequence where sales data appears to precede the adjustment.
One study released by the University of Nevada, Las Vegas gaming research center examined NBA regular-season games and found that apparel-driven sentiment shifts accounted for roughly 12 percent of mid-week line movements in the sample period. The analysis relied on anonymized sales records from three major retailers and compared them against daily closing spreads published by licensed operators. Similar patterns appeared in NCAA tournament play, where fan purchases of team gear intensified ahead of early-round matchups and spreads tightened or expanded in response.
Documented Examples Across Leagues
During the 2026 NBA playoffs, sales of one Eastern Conference team's apparel rose 48 percent in the week after a key player returned from injury. Three days later, sportsbooks moved that team's spread from +3.5 to +2.5 for its next series game. Observers note that comparable sequences repeated across multiple series, with the sales data available publicly through retail reports before the line changes became widely discussed.
College basketball conferences have produced parallel observations. A Big Ten program recorded a 62 percent sales increase following a late-season winning streak, and point spreads for its conference tournament opener shifted two points toward the favored side within five days. Analysts attribute the timing to the lag between retail restocking decisions and the incorporation of new sentiment data into pricing models used by oddsmakers.
Integration With Broader Market Indicators
Apparel sales do not operate in isolation. They interact with injury reports, travel schedules, and historical performance trends that oddsmakers already weigh. Yet the retail signal provides an additional measurable input because sales figures update daily and reflect consumer behavior in real time. Figures compiled by industry groups such as the American Gaming Association highlight how public sentiment metrics influence handle distribution, and apparel data fits within that category.
Canadian retail statistics released through Statistics Canada offer a secondary cross-check for North American teams with cross-border fan bases. Those records show synchronized sales increases for certain franchises that later appeared in adjusted spreads for games played in U.S. arenas. The convergence of multiple data streams strengthens the observed relationship without implying direct causation.
Conclusion
Patterns linking apparel sales spikes to basketball point spread adjustments rest on documented correlations between retail transaction volumes and subsequent line movements. Analysts continue to refine models that incorporate merchandise data alongside traditional performance statistics, and July 2026 observations reinforced the consistency of these sequences across both professional and collegiate levels. The relationship remains one component within a larger framework of market indicators used by sportsbooks and researchers alike.