Travel Fatigue Patterns Linked to Point Spread Shifts in Professional Athletics
Katja Long · Oct 6, 2026
Travel Fatigue Patterns Linked to Point Spread Shifts in Professional Athletics
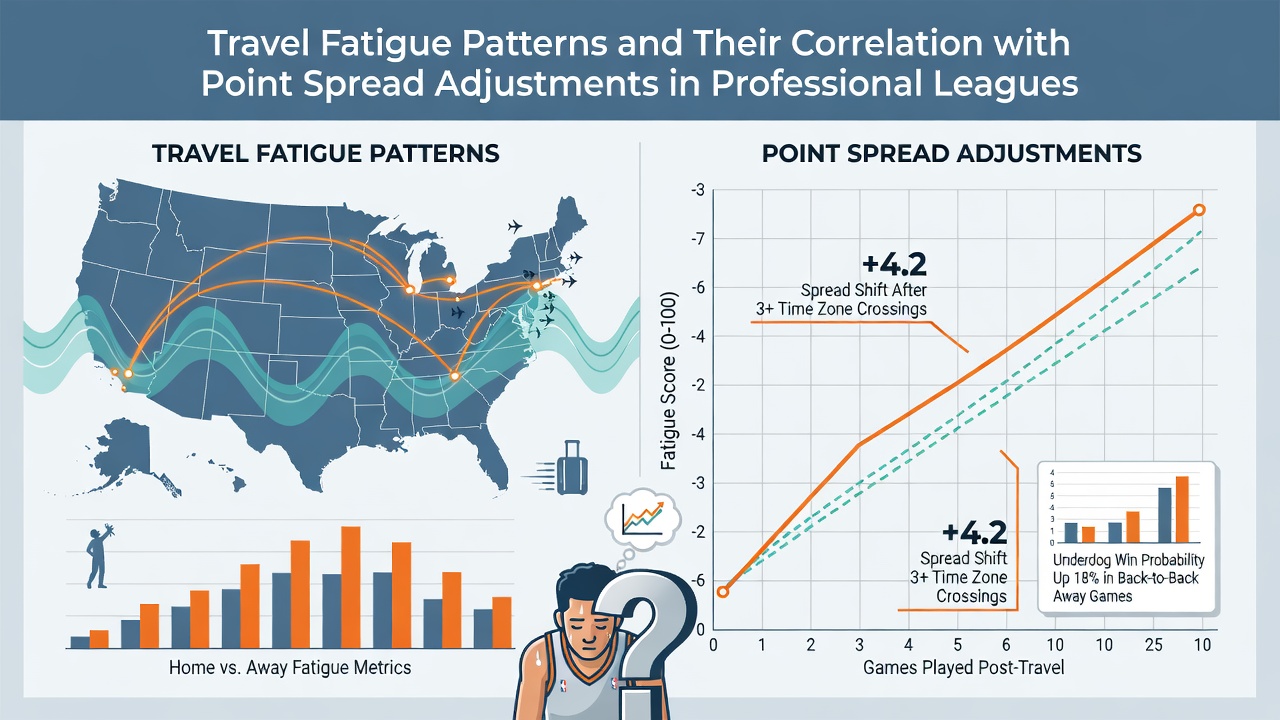
Travel fatigue emerges as a measurable factor in professional sports when teams cross multiple time zones or endure long-haul flights before competition, and data from multiple leagues shows consistent correlations with adjustments in point spreads. Researchers tracking performance metrics across the NFL, NBA, and MLB have documented declines in scoring efficiency and defensive consistency after extended travel, which leads oddsmakers to recalibrate lines accordingly. Studies indicate that teams arriving from distances exceeding 1,000 miles often post lower offensive outputs in the first 48 hours post-arrival, prompting spreads to widen by an average of 1.5 to 3 points in favor of the rested opponent.
October 2026 schedules across North American leagues highlight these patterns once again, with interconference matchups in the NFL and cross-country series in MLB and the NBA creating fresh datasets for analysis. Observers note that fatigue accumulates not only from flight duration but also from disrupted sleep cycles and changes in meal timing, factors that compound when teams play back-to-back games. League statisticians compile these variables into models that help explain why visiting squads from the Pacific time zone frequently underperform in early evening Eastern games.
Documented Performance Declines After Extended Travel
Evidence from longitudinal tracking reveals that NBA teams traveling across three or more time zones exhibit reduced three-point shooting percentages and increased turnovers in the opening quarter of games played within 24 hours of arrival. Similar patterns appear in NFL data, where rushing yardage averages drop by 12 to 18 percent for squads arriving the day before a contest. MLB researchers have recorded elevated earned run averages for starting pitchers who cross the continental United States, with the effect most pronounced during day games following overnight flights.
Coaches adjust rotations and practice intensity to mitigate these effects, yet the statistical impact persists across seasons. Analysts reviewing five-year datasets find that point spreads move in tandem with travel distance metrics, with sportsbooks incorporating proprietary algorithms that factor in cumulative miles logged during the prior seven days. These adjustments reflect observed outcomes rather than speculation, as historical results demonstrate repeatable trends when travel fatigue intersects with schedule density.
League-Specific Adjustments and Data Patterns
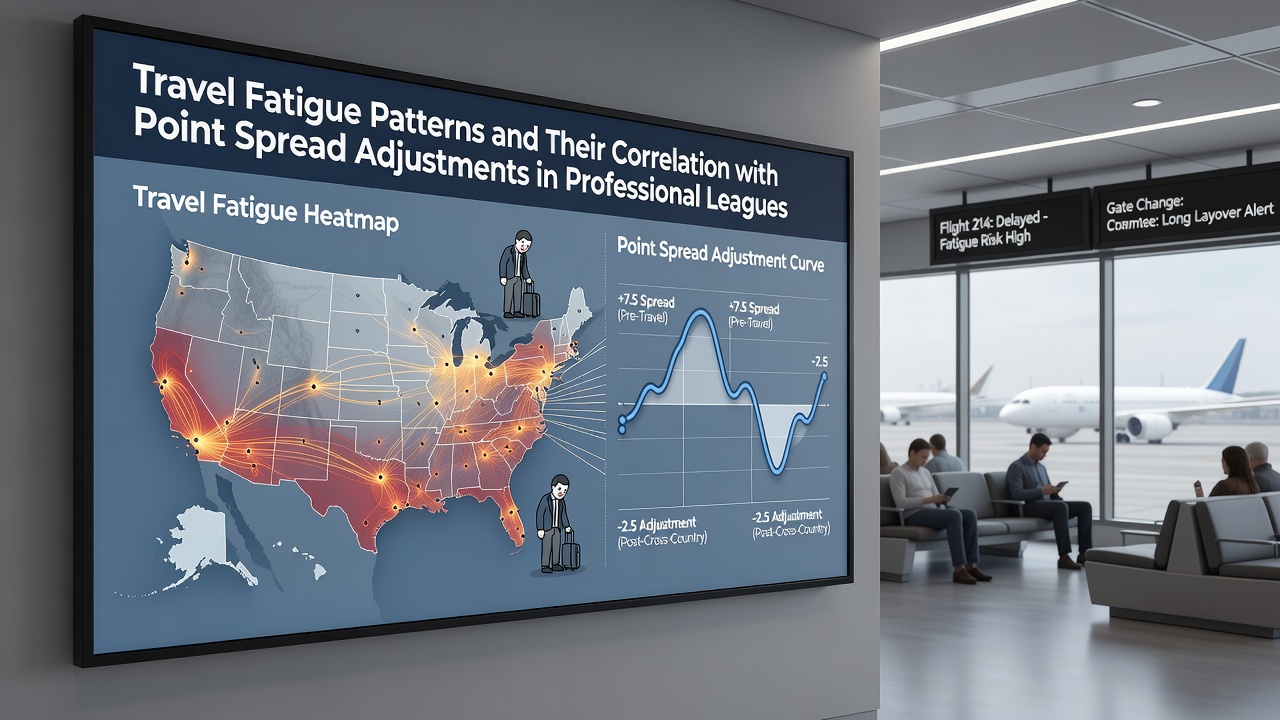
Each major league applies distinct protocols when accounting for travel, yet the underlying correlation with point spread movement remains consistent. NBA schedules feature the highest volume of cross-country trips, and figures reveal that spreads shift by an average of 2.2 points when one team has logged at least 2,500 air miles in the preceding 72 hours. NFL data shows smaller but still measurable shifts, typically 1.8 points, concentrated in Sunday afternoon games involving West Coast visitors. MLB spreads adjust most noticeably during interleague play that spans multiple time zones, where starting pitcher fatigue metrics influence totals lines as well.
Those who study these patterns emphasize the role of recovery windows, noting that teams granted an extra day between games show narrower gaps in performance statistics. In October 2026, early season NBA road trips and late MLB playoff travel provide ongoing case studies for these dynamics, with updated models incorporating real-time flight data and biometric recovery indicators.
Integration of Travel Metrics into Spread Calculations
Oddsmakers integrate travel fatigue variables through layered statistical frameworks that combine distance, time zone differential, and recovery days. Research published by the American College of Sports Medicine outlines how circadian disruption affects reaction time and muscle recovery, providing quantitative inputs for these models. When these variables align with historical performance dips, point spreads widen to reflect the elevated probability of underperformance by the traveling side.
Canadian and Australian sports science institutes have contributed comparative studies showing parallel effects in ice hockey and rugby, where long-haul travel similarly correlates with adjusted betting lines. European football federations track analogous patterns during Champions League fixtures that require transcontinental movement, though regulatory environments differ from North American leagues. These cross-regional findings reinforce that point spread adjustments follow observable fatigue patterns rather than isolated anomalies.
Conclusion
Travel fatigue patterns continue to shape point spread adjustments across professional leagues as data collection grows more granular each season. October 2026 schedules supply fresh examples of how distance, time zone changes, and recovery periods influence performance metrics and subsequent line movements. Observers tracking these variables see repeatable correlations that inform both league analysis and market responses without relying on subjective interpretation.