Workload Data Analytics Reshape Mid-Season Football Wagering Dynamics
Katja Long · Sep 8, 2026
Workload Data Analytics Reshape Mid-Season Football Wagering Dynamics
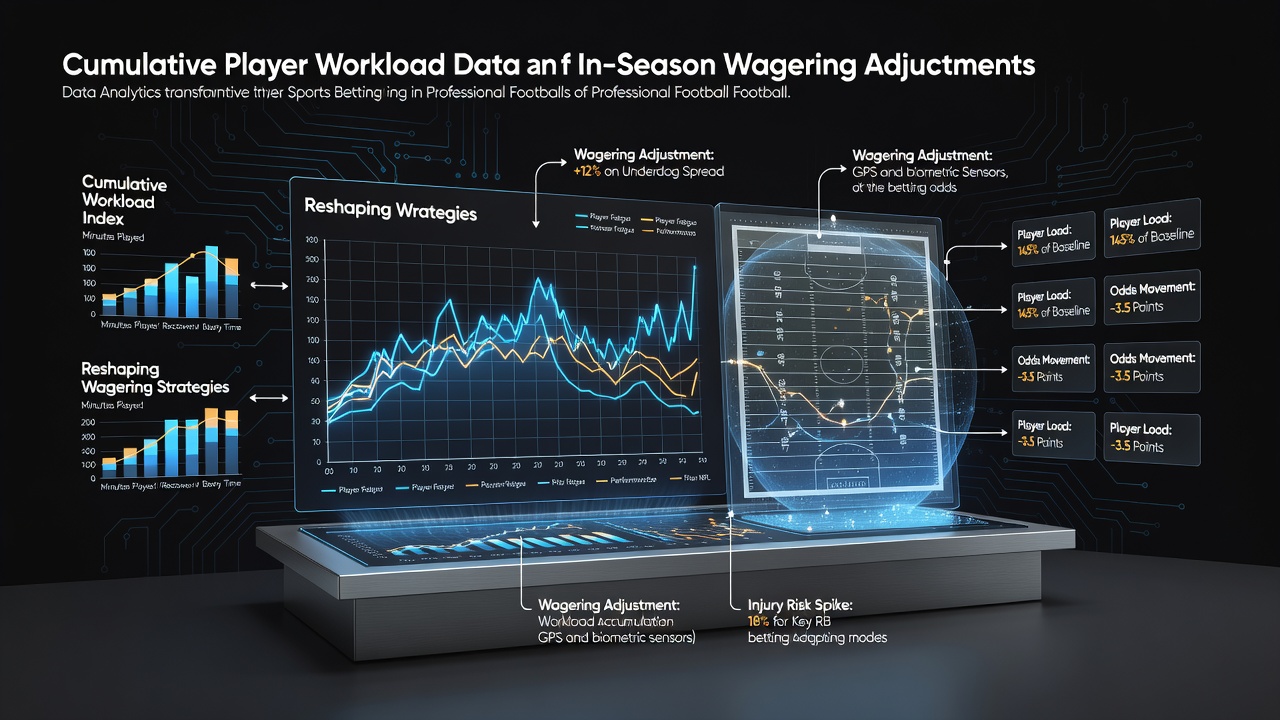
Professional football circuits have integrated cumulative player workload data into performance evaluations for years, and this information now feeds directly into live odds calculations during regular seasons. Teams collect metrics through GPS trackers, heart-rate monitors, and recovery software that log total distance covered, high-intensity sprints, and acute-to-chronic workload ratios across multiple weeks. Betting operators receive aggregated versions of these datasets from third-party analytics firms, which then adjust point spreads and player props when cumulative fatigue indicators cross established thresholds.
Collection Methods and Data Integration
Coaching staffs record every practice and game session, producing time-stamped files that quantify mechanical stress on specific muscle groups. In September 2026 several clubs began feeding these raw numbers into centralized league databases that anonymize individual identifiers while preserving positional averages. Oddsmakers access these processed files through secure feeds that update every twenty-four hours, allowing line movements to reflect changes in team-wide fatigue rather than isolated injury reports alone. Analysts cross-reference the workload totals with historical performance splits, noting how elevated ratios in the prior three weeks correlate with reduced rushing efficiency and increased turnover rates in subsequent contests.
Impact on In-Season Line Adjustments
Bookmakers recalibrate totals and side bets when cumulative workload spikes appear in defensive fronts or skill positions. A defensive line that logged above-average snap counts during the previous fortnight often sees its implied sack rate lowered in the current week, prompting a shift in the over-under on combined sacks plus tackles for loss. Data from multiple circuits shows that teams entering Week 8 with elevated acute workload ratios have covered the spread at lower rates than those maintaining balanced loads, prompting operators to widen margins on underdog selections when such patterns emerge.
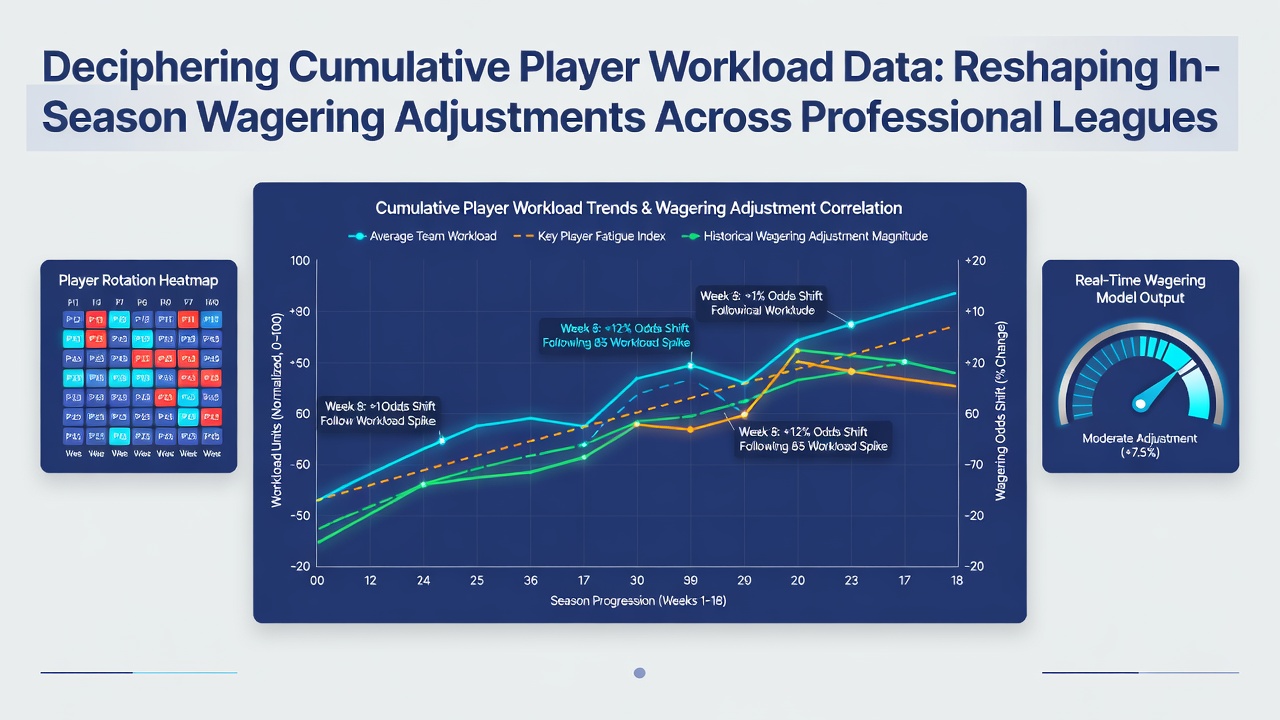
Prop markets adjust more granularly because individual player tracking reveals specific declines in acceleration and deceleration metrics. Running backs who exceed weekly distance thresholds exhibit measurable drops in yards after contact, so sportsbooks lower projected yardage lines for those athletes even before official injury designations appear. Quarterbacks facing elevated pocket-pressure workloads from prior games show reduced completion percentages on deep attempts, leading to revised over-under totals on passing yards that incorporate the fatigue component rather than relying solely on matchup history.
Regional Regulatory Context and Reporting Standards
North American gaming authorities require operators to disclose how external data sources influence odds, and workload analytics fall under these transparency rules. A 2025 report issued by the National Council on Problem Gambling examined how performance-derived variables affect real-time betting products and recommended standardized disclosure formats. Canadian provincial regulators have adopted similar guidelines that mandate documentation whenever cumulative metrics alter posted lines, ensuring bettors receive notice when fatigue models contribute to movement. European football leagues maintain parallel systems through the European Association for Sport Management, where workload thresholds trigger mandatory rest protocols that indirectly shape weekend wagering markets.
Case Examples Across Circuits
One club in the 2026 season entered a Thursday-night matchup with defensive backs carrying a three-week workload ratio 18 percent above league average, and markets responded by moving the total points line downward by three points within forty-eight hours of the data release. Observers noted that the same pattern repeated across multiple divisions when offensive linemen accumulated elevated snap counts during short-week preparations, resulting in measurable reductions in implied rushing yardage props. Those adjustments occur because the underlying algorithms weight recent cumulative loads more heavily than single-game statistics, producing line movements that precede traditional injury reports by several days.
Conclusion
Cumulative player workload data continues to refine how professional football markets recalibrate during active seasons. Operators incorporate positional fatigue averages into both pregame and in-play products, while regulatory frameworks in multiple jurisdictions require disclosure of these inputs. The practice has expanded from isolated pilot programs to standardized procedures that now affect line construction across major circuits, with updates occurring on daily cycles that reflect the most recent tracking uploads.